Why take on sugar? Why now?
Added sugars, as opposed to naturally-occurring sugars, in processed foods are a primary driver of the obesity epidemic and have direct metabolic effects that raise the risk of type 2 diabetes, hypertension, and heart and liver diseases. They also promote dental disease.
Health Impacts of Sugar
Heart disease. Eating 12–30 teaspoons of added sugar per day increases the risk of dying from heart disease by nearly one-third over those who eat less. Eating more than 30 teaspoons increases the risk nearly three-fold. Sugary drinks contribute to more than 52,000 deaths from cardiovascular disease every year in the US.
Diabetes. Drinking just one to two 12-oz sodas per day can increase your risk of developing type 2 diabetes by 26% and the risk of developing hypertension by 12%. More than 1 in 3 US adults has pre-diabetes, and 40 percent of all children are predicted to develop diabetes in their lifetime.
Dental decay. Regular soda consumption is associated with nearly twice the risk of dental decay in children. Adults who drink 1-2 sugary drinks per day have 30% more dental disease compared with adults who consume no sugary drinks.
Types of Added Sugars* found in Packaged Foods
- brown sugar
- confectioner's powdered sugar
- corn syrup, corn syrup solids
- dextrose, fructose, lactose, maltose, sucrose
- high-fructose corn syrup (HFCS)
- honey
- invert sugar
- malt syrup
- maple syrup
- molasses
- nectars (e.g., peach or pear nectar)
- raw sugar
- white table (granulated) sugar
- and others
Check out Sugar Science for more information on added sugars in packaged foods.
*Added sugars are sugars and syrups that are added to foods or beverages when they are processed or prepared. They don’t include naturally occurring sugars such as those in milk and fruit.
Sugar is added to three out of four of the products found on grocery shelves, making it nearly impossible to avoid. The typical American consumes about 17 teaspoons of added sugars per day, roughly 50 percent more than is recommended by the Dietary Guidelines for Americans (DGA) and the World Health Organization (WHO). To prevent chronic diseases and save lives, we must change the makeup and marketing of packaged foods to make it easier for Americans to reduce sugar intake to recommended levels, and to increase our consumption of healthful food.
Check out our Sugar Overload Calculator to see how added sugars in packaged foods add up
Why take on sugar now? After years of research, we have a strong (and growing) body of scientific evidence that demonstrates the harm caused by added sugars. The media are sounding the alarm as well, helping Americans to get the message that excessive sugar is unhealthy and we should cut back. Overall, sugar consumption in America is declining, but it is still too high, and it varies by age, gender, race, and income. As a result, we continue to see the health impacts and inequities associated with overconsumption.
The U.S. consumes too much sugar!
The United States leads the world in consumption of added sugars and ranks third in the world in sales of sugary drinks. All of this sugar has consequences - the U.S. has one of the highest overall obesity rates in the world, and the highest rate of childhood obesityi. Over 30 million Americans have diabetes, and another 84 million are at risk of developing diabetesii.
Sugary drinks contribute to more than 52,000 deaths from cardiovascular disease every year in the USiii

Source: Euromitor, obtained from Washington Post, Where people around the world eat the most sugar and fat, February 5, 2015.

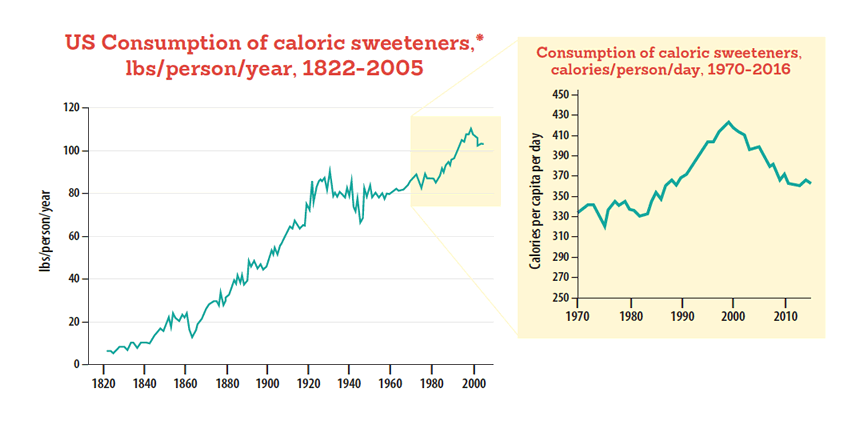
While U.S. sugar consumption has begun to decline since 2000, it is still extremely high
Sugar consumption in the US has risen steeply and steadily over the past two centuries. The rise in sugar consumption has corresponded with higher rates of obesity and diabetes – sugar consumption accelerated around 1980, when the obesity epidemic started, and the diabetes epidemic started a decade later, in the 1990s. Sugar consumption peaked in 1999 at about 425 calories per day, and then began to decline. However, the decline has plateaued since 2010.

*“Caloric sweeteners” includes corn syrup, cane and beet sugar, and other sweeteners such as honey, agave, and maple syrup
Source: USDA Economic Research Service
The Dietary Guidelines for Americans 2015–2020 recommends limiting added sugars to less than 10 percent of our daily calories--about 12 teaspoons of added sugars per day. The American Heart Association sets an even lower limit, and makes recommendations based on age and gender.

Source: American Heart Association
On average, Americans of all ages are consuming more added sugar than recommended by the American Heart Association, the 2015 Dietary Guidelines for Americans, and the World Health Organization.

Source: NHANES What We Eat in America, 2013-2014
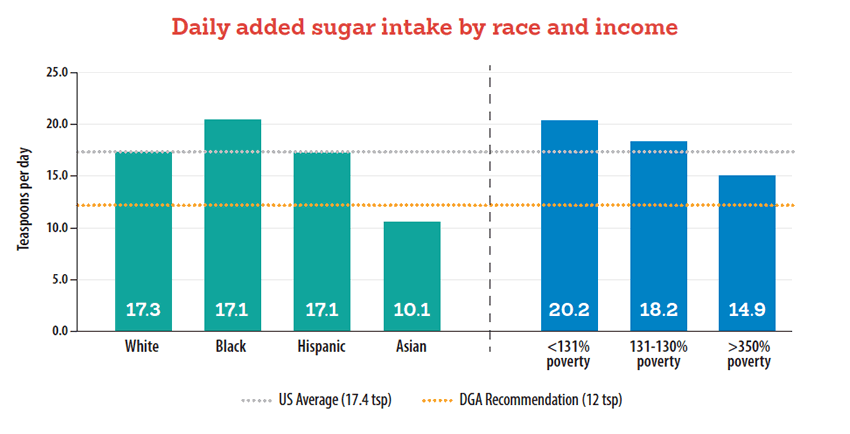
The charts above show how added sugar intake differs substantially by age and gender. The chart below shows that intake also varies by race and income. Overall, adolescents and young adults, Blacks, low income people, and men consume the most added sugar.

Source: Bowman SA, Clemens JC, Martin CL, et al. Added Sugars Intake of Americans: What We Eat in America, NHANES 2013-2014. USDA Food Surveys Research Group. Dietary Date Brief No. 18. May 2017.
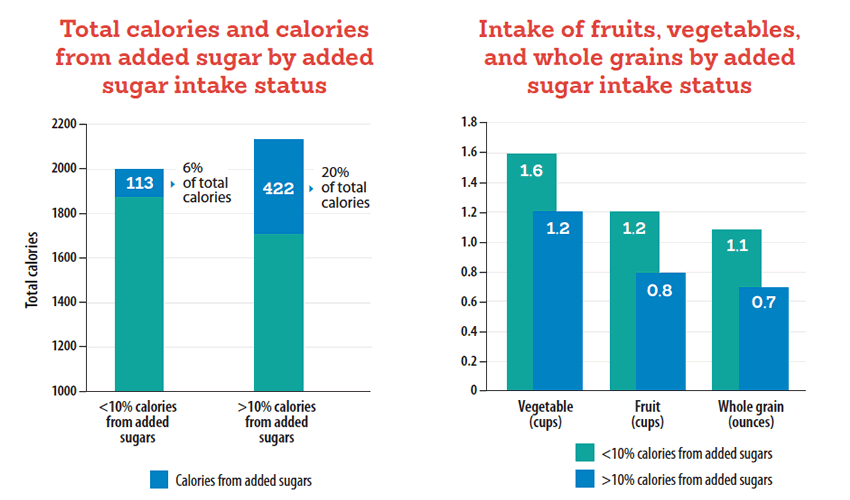
But average intake doesn’t tell the whole story. More than half of Americans (58 percent) exceed the Dietary Guidelines for Americans recommendation to limit added sugar intake to less than 10% of total calories. They are eating, on average, over 25 teaspoons of sugar a day, or nearly 20 percent of their total calories. Those who eat too much sugar also tend to eat more total calories and fewer healthy foods such as fruit, vegetables, and whole grains.

People who meet the DGA recommendation to eat less than 10% of calories from added sugar eat less total calories on average, and only about 6% of calories are from added sugar, compared to about 20% of calories from added sugar among the majority of Americans who do not meet the DGA recommendation. Additionally, those eating less than 10% of their calories from added sugar also tend to eat more vegetables, fruit, and whole grains, indicating that high sugar intake is associated with an overall lower quality diet.
Source: Bowman SA, Clemens JC, Martin CL, et al. Added Sugars Intake of Americans: What We Eat in America, NHANES 2013-2014. USDA Food Surveys Research Group. Dietary Date Brief No. 18. May 2017
- Consuming added sugars raises the risk of developing type 2 diabetes, obesity, hypertension, heart and liver diseases, and tooth decay.
- Americans consume more sugar than people in any other country in the world.
- Over two-thirds of children and adolescents, and more than half of adults consume more added sugars than is recommended by the Dietary Guidelines for Americans and the World Health Organization.
- Added sugar intake varies by age, gender, race, and income – adolescents and young adults, Blacks, low income people, and men consume more added sugar than average.
- People who eat too much added sugar tend to have a poor overall diet that is higher in calories and lower in fruits, vegetables, and whole grains.
Where are we getting all this sugar?
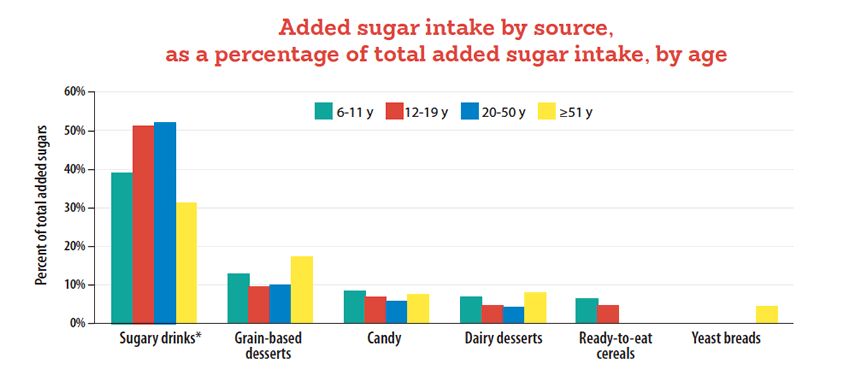
Sugary drinks account for nearly half (46%) of the added sugars in the American diet and are the largest source of added sugars for all age groups; they are far and away the largest contributor to sugar intake among people ages 12–50 years. [See this section for more on the specific health risks of sugary drinks and this report for more on sugary drink consumption patterns.]

2009-2010 data from US Department of Health and Human Services and U.S. Department of Agriculture. 2015 – 2020 Dietary Guidelines for Americans. 8th Edition. December 2015.
Snacks and sweets are the second largest source, contributing 31 percent of added sugars. The chart below breaks this category down further to show that grain-based deserts are a major contributor of added sugar, especially among older adults. Candy and breakfast cereals contribute relatively high proportions of added sugars among children ages six to eleven.

*Sugary drinks include soda, energy drinks, sports drinks, fruit drinks, coffee, tea, and sweetened milk. Sugars/honey and syrups/toppings were excluded.
Source: Drewnowski A, Rehm CD. Consumption of added sugars among US children and adults by food purchase location and food source. Am J Clin Nutr. 2014;100(3):901–7.
Where do we get most of these foods and beverages?
These days, sugary foods and drinks are available almost everywhere. We buy them in the obvious places such as supermarkets, groceries, and fast food restaurants. They’re readily available in our workplaces and schools, in government buildings, sports arenas, and movie theaters. But we can also easily find them in more unlikely places: gas stations, city parks, museums, sports stores, office supply and home improvement stores, even craft and hobby stores.
As you can see from the pie charts below, store-bought added sugars account for 65-70 percent of what we consume (depending on age). The total amount of added sugars from meals and beverages from restaurants, school cafeterias, and other sources is considerably lower. For example, the amount of added sugars contributed by school meals among the 12- to 19-year-old age group is 0.9 teaspoons/day, or about 15 calories per day.

Drewnowski A, Rehm CD. Consumption of added sugars among US children and adults by food purchase location and food source. Am J Clin Nutr. 2014;100(3):901–7.
Great sources for local data on health impacts
To find out about the rates of diabetes, obesity, heart disease, and other conditions associated with added sugar consumption, in your state, county, or city, check out these data sources from the Centers for Disease Control (CDC).
- Behavioral Risk Factor Surveillance System (BRFSS): all adult health outcomes. State, county, city levels. Also see the BRFSS Widget for obesity and diabetes. State level.
- Diabetes Burden Toolkit: includes economic burden of diabetes. State level.
- Diabetes data: includes prediabetes, diagnosed diabetes, risk factors for diagnosis, and risk factors for complications. National, state, and county levels.
- 500 Cities Project: various health outcomes on maps. City level.
- Heart disease and stroke data: by racial/ethnic group, with maps of social and environmental conditions and health services. National, state, territory, and county level.
- Obesity and overweight data and statistics: adults, adolescents, and Women, Infants, and Children (WIC) two to four year-old participants. States, territories and some local levels.
- Youth Online: data from the Youth Risk Behavior Surveillance System (YRBSS), 1999-2015, including obesity and soda consumption. State and local levels.
Other resources:
- Community Commons: gives public access to thousands of data layers that allow mapping and reporting on small geographic areas. Local level.
- Trust for America’s Health State of Obesity: rates and trends, policy analysis, state briefs, fast facts and more. State level.
- Sugar Science: Evidence-based, scientific information about sugar and health
ENDNOTES
iGDB 2015 Obesity Collaborators. Health Effects of Overweight and Obesity in 195 Countries over 25 years. NEJM. 2017; 377(1)
iiCenters for Disease Control and Prevention. National Diabetes Statistics Report, 2017. Atlanta, GA: Centers for Disease Control and Prevention, U.S. Department of Health and Human Services; 2017.
iiiMicha R, Penalvo JL, Cudhea F, et al. Association between dietary factors and mortality from heart disease, stroke, and type 2 diabetes in the United States. JAMA. 2017;317(9)
